HOTEND / Materials
The Strongest Infill Wasn’t the Stiffest in This 3D-Printing Test
A tensile study of Z-ULTRAT found different winners for strength and stiffness—and used machine learning to explore the compromises.
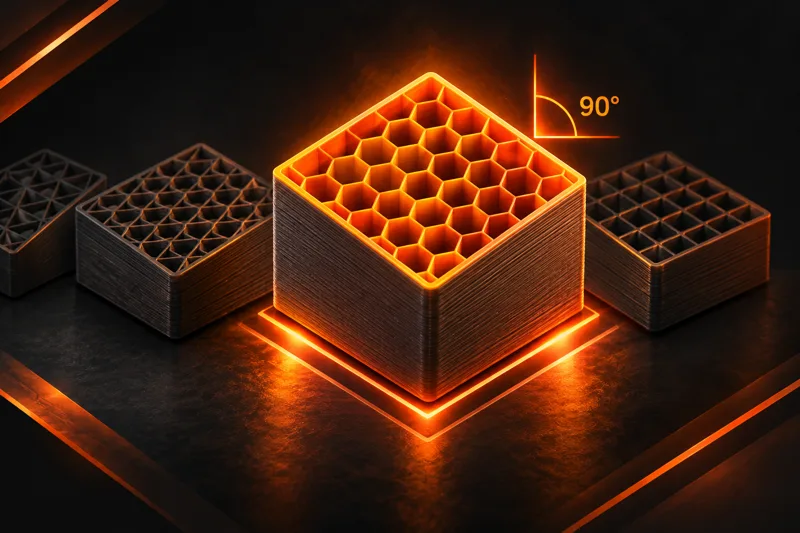
A honeycomb-filled test piece recorded the highest tensile strength in a study of 3D-printed Z-ULTRAT—but another honeycomb configuration was the stiffest, and a grid-filled one led on yield and breaking stress. The difference was not just the infill: the researchers also changed the specimens’ orientation on the printer.
In the research paper by Farid Bettine and colleagues, the strongest reported combination was honeycomb at the study’s 90° orientation, with a tensile strength of 38.41 MPa. The lowest was linear infill at 45°, at 18.60 MPa. That is a little more than a twofold difference between two configurations—not a measurement of what changing infill alone will do.
The team tested four patterns—linear, grid, honeycomb and octagonal—at five orientations, for 20 combinations. The specimens were sliced in Z-SUITE and printed on a Zortrax M300 Plus using 50% infill and 0.15 mm layers. The paper reports a 240 °C nozzle temperature and a 0.4 mm nozzle. Z-ULTRAT is an ABS-based filament from Zortrax; the findings should not be treated as rankings for every ABS blend, slicer or printer.
Different jobs, different winners
The researchers pulled the specimens in a tensile-testing machine and recorded four properties. Tensile strength describes the maximum stress reached during the pull. Elastic modulus is a measure of stiffness: how much the material resists deformation in its initial elastic range.
Honeycomb at 45° had the highest reported elastic modulus, at 2.97 GPa, while still reaching 36.23 MPa in tensile strength. Grid at 60° reached 37.81 MPa in tensile strength and led the test in both yield stress and breaking stress. Those distinctions matter when choosing between a part that needs to resist flexing and one whose priority is carrying a high tensile load.
The paper labels the angles as specimen orientations, but its description of the rotation axes is not fully clear. Makers should consult its orientation diagram rather than assume the numbers translate directly to a particular rotation control in their own slicer.
Where the AI fits
The strength numbers came from physical tests, not from an AI discovering a new infill. The team then used the measurements to build four separate neural-network models, one for each mechanical property. An optimization algorithm searched the same tested pattern-and-orientation choices for combinations offering different balances of the four responses.
That produced a set of model-selected trade-offs rather than one universally best setting. The researchers limited the search to the four patterns and five angles they had already examined; the selected combinations were not additional physical tests.
There are important limits to the comparison. The available dataset has one processed result per configuration, but the authors could not recover the number of specimens tested or the individual replicate records. They also lacked the original random seed for the neural-network split, and a supplementary evaluation used only two configurations. The model’s close fit is therefore not proof that it will predict unfamiliar prints reliably.
For a maker, the useful takeaway is to consider infill and orientation together, then test the actual part under its expected load. This experiment offers promising combinations for one material and setup, not a substitute for repeated testing when a print’s failure would matter.
Sources.
Original reporting, references, and further reading.